How to set prices using Meku analytics
Use the analytics page to set prices with evidence — spot your margin makers, your traffic drivers, and the products you're quietly underpricing.
Your prices are probably inherited — from the previous owner, your supplier’s suggestion, or “what everyone else charges.” That works until your supplier raises prices, your rent goes up, or a competitor opens nearby. Then you need actual numbers. Meku’s analytics page is where those numbers live.
What you need before you start
- At least a week of sales recorded on your POS
- Your expenses for the same week recorded (see How to track business expenses on Meku)
- An open mind about which products are actually making you money
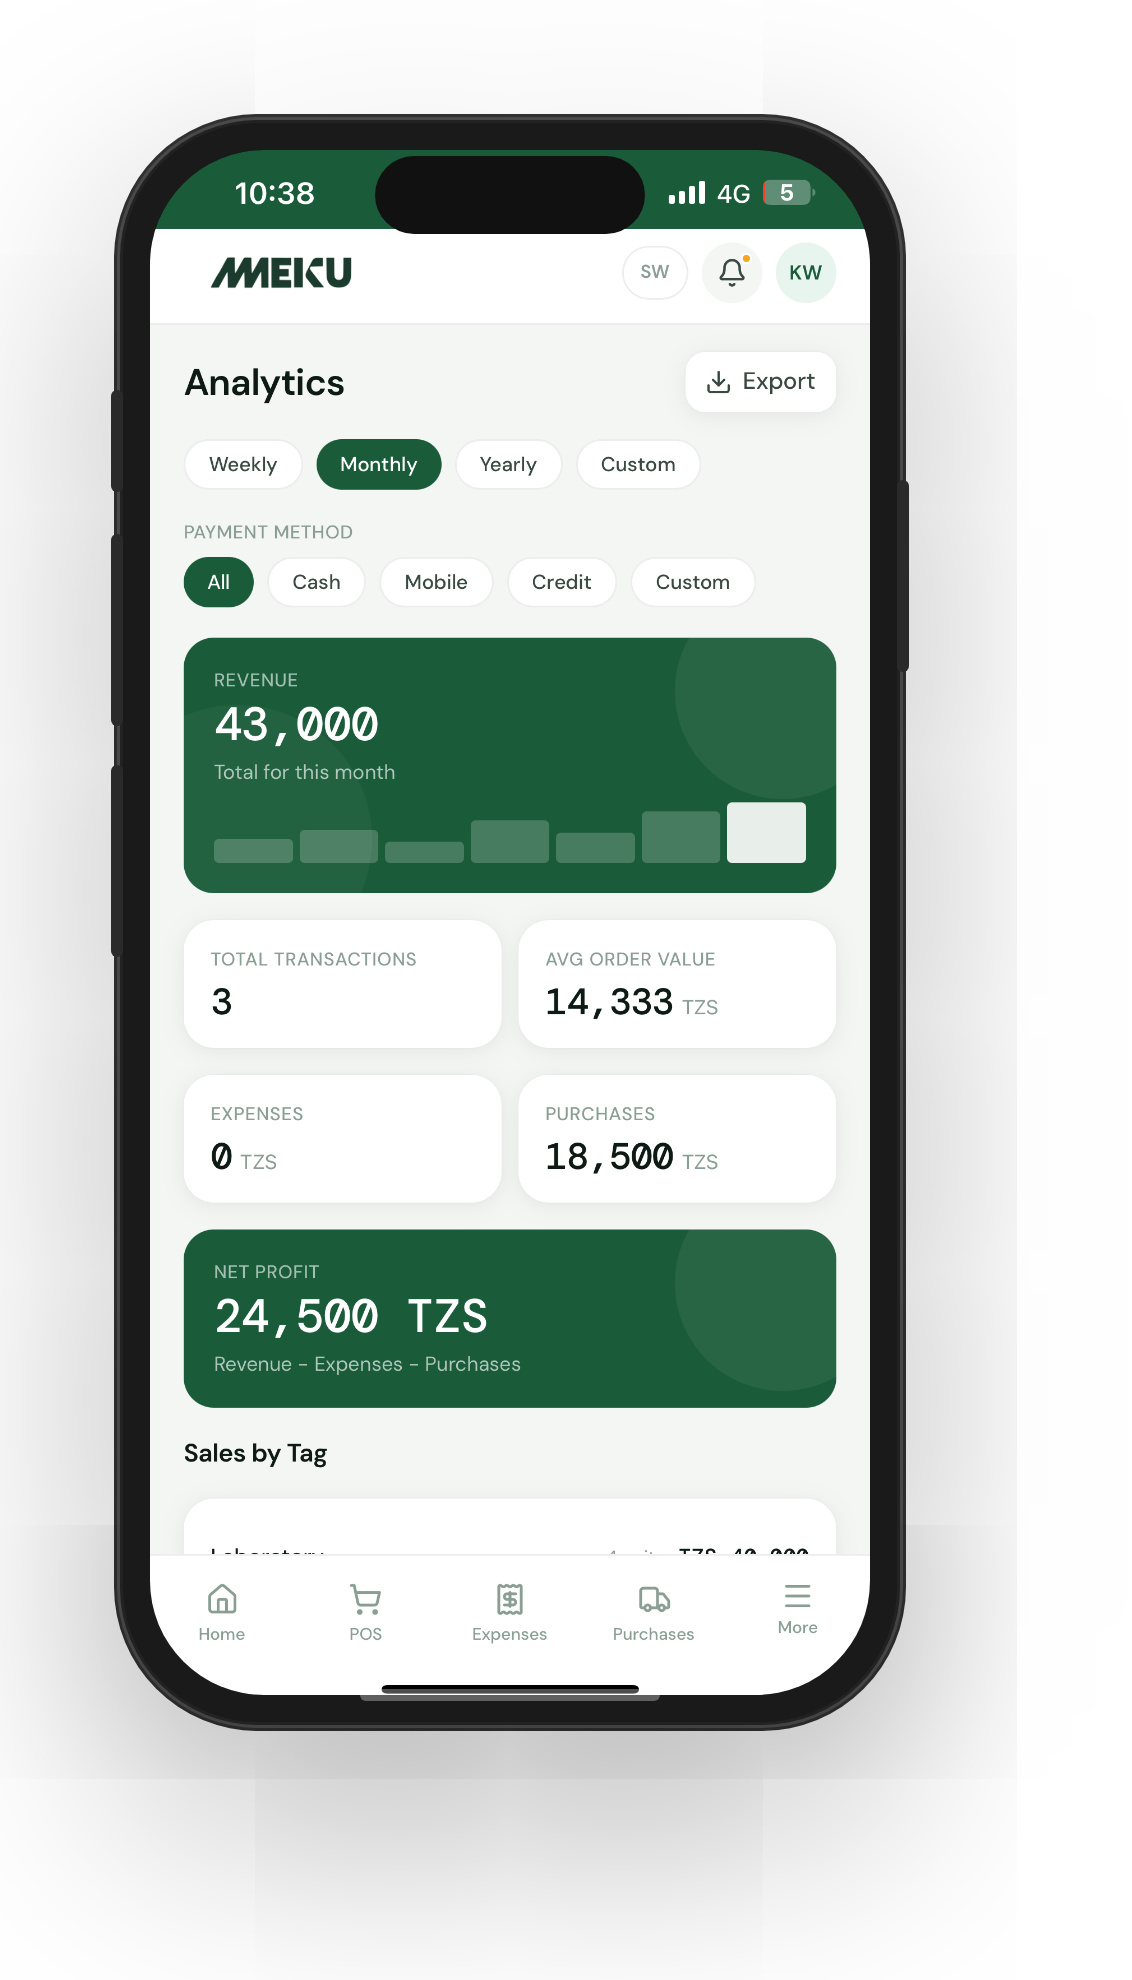
Step 1: Open Analytics → Revenue analysis
The hero card shows your total revenue for the period (Today / Month / Year / Custom). The sparkline next to it shows the trend — flat, growing, or shrinking. The breakdown below shows revenue by payment method (cash / mobile money / credit / custom).
Don’t skip the payment-method breakdown. If 40% of your weekly revenue is on credit, your “revenue” number overstates your cash position by a lot.
Step 2: Look at your top products
Sort by units sold and by revenue separately. The two lists are usually different, and the gap is the lesson.
- High-revenue, low-volume products are your margin makers. Protect them.
- High-volume, low-revenue products are your traffic drivers. They bring people in, but don’t depend on them for profit.
- High-volume AND high-revenue? That’s a winner — don’t fiddle with the price.
- Low on both lists? Drop the product or test a different price.
Step 3: Cross-check with the profit page
Open Analytics → Profit. This is your revenue minus your expenses, with the gap displayed as net profit. The green/red header tells you whether you made money this period; the metric row breaks it down.
The first time you open this page, you’ll either be pleasantly surprised or quietly horrified. Both reactions are useful. The number is the truth — work back from it.
Step 4: Run a pricing experiment
Pick one mid-volume product. Raise its price by 10%. Watch sales for a week. If units sold barely move, the higher price was always available — keep it. If they drop more than 10%, drop the price back. This is the cheapest market research you can do.
Tip: Never change more than two prices at once. If you change ten and revenue moves, you won’t know which change did what.
Step 5: Compare period over period
Use the Custom date range chip to compare this month to last month directly. Set the picker to the current month, note the totals, then change it to the previous month. The delta is your business trajectory.
If your business is growing, do this once a month. If it’s struggling, do it weekly until things improve.
Common questions
Why doesn’t the revenue page show profit? Revenue is what you sold; profit is revenue minus what you spent. They live on different pages because they answer different questions. Open Profit when you want the real number; Revenue when you want to understand sales activity.
What’s the difference between “revenue” and “GMV”? For your in-store sales, they’re the same thing. For online orders, GMV includes the customer-paid service fee; revenue is what you actually keep (the merchandise total). The Earnings page is where you see what’s owed to you for payout.
How often should I look at this? Weekly is the sweet spot. Daily is too noisy — one good day skews the picture. Monthly is too late — the bad pattern is already three weeks old.
What to read next
- How to track stock on Meku without counting every day — pricing depends on knowing what’s actually on your shelf.
- How to track business expenses on Meku — the expenses half of your profit equation.
- How to track credit sales and customer debts on Meku — credit affects your cash flow even when revenue looks healthy.
Open merchant.meku.co.tz/analytics/revenue-analysis to start.